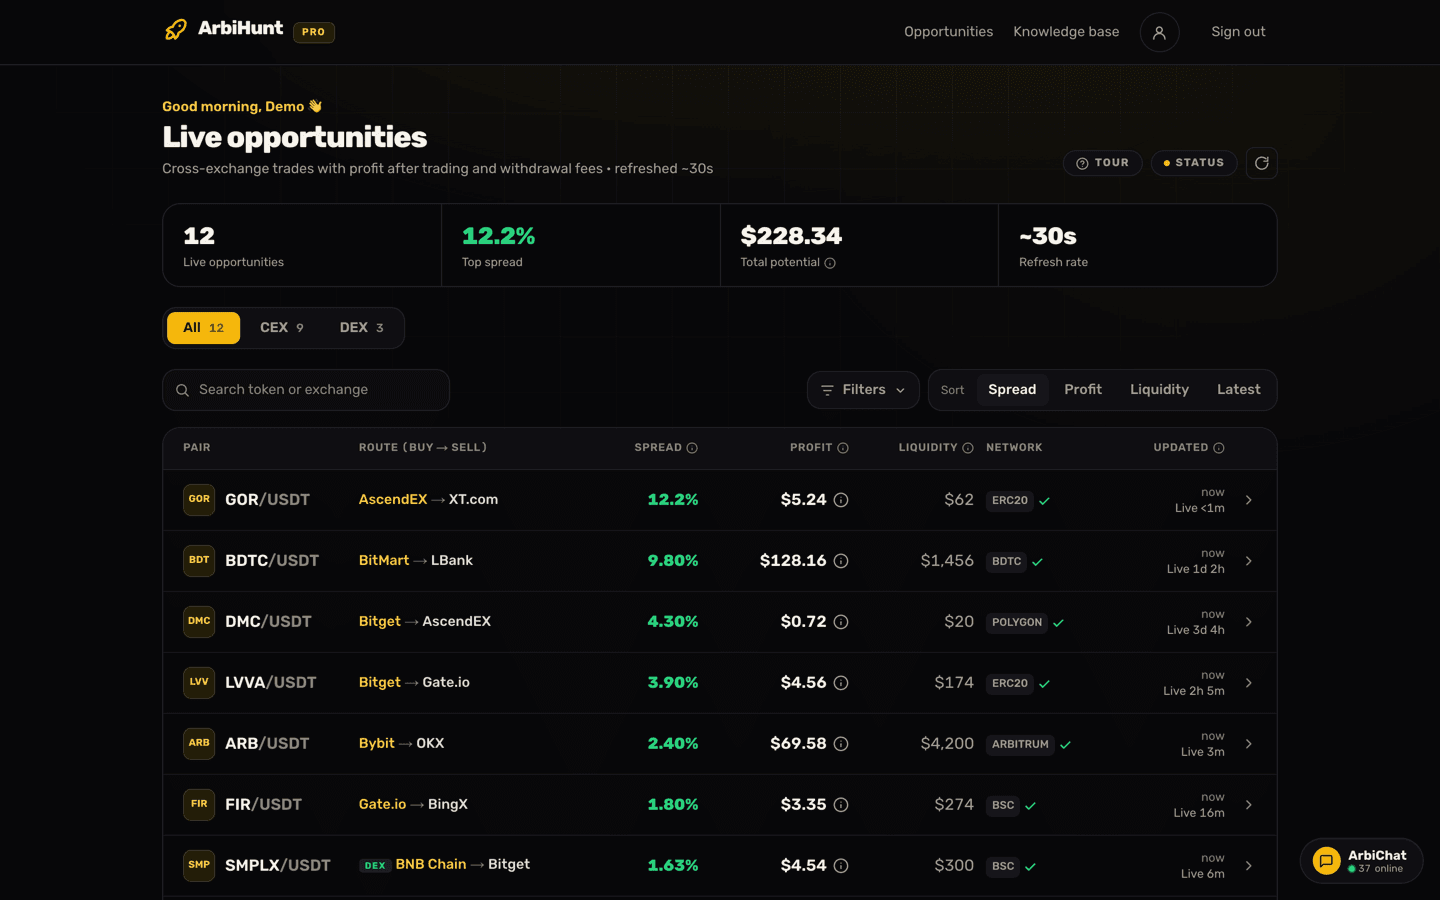
The dashboard is one screen: a live, ranked list of cross-exchange trades across the 26 exchanges ArbiHunt scans, rebuilt roughly every 30 seconds. Each row is a single trade idea: the same coin, cheaper on one venue than another, with enough numbers beside it to judge whether it is worth touching. Top to bottom you get a header (a guided TOUR, a STATUS pill linking to the public status page, a manual refresh), four KPI tiles, a switch between All, CEX (centralized exchange) and DEX trades, then the toolbar and the table; on a phone each row becomes a card with the same fields. This guide walks it tile by tile and column by column, and ends with a pre-trade checklist. Its screenshots use example rows, so read them for the layout rather than the numbers: live, most spreads are far narrower, and most profits far smaller.
One framing point first: ArbiHunt is an information tool. It finds, prices and ranks opportunities; it never connects to your exchange accounts, never asks for API keys, never holds funds and never places an order. Every trade is yours.
What the four tiles at the top actually count
| Tile | What it means | Free? |
|---|---|---|
| Live opportunities | How many opportunities are on the board right now | Yes |
| Top spread | The widest spread anywhere on the board | Yes |
| Total potential | The profit column added up across the board, after every fee | PRO |
| Refresh rate | How often the scanner re-reads the order books | Yes |
Live opportunities is the market-wide count, not the number of rows you can scroll: the board loads a top slice of the ranked list. Refresh rate is the scanner's cycle, a constant rather than a per-row timestamp. Top spread is the single widest spread currently live, locked PRO rows included. It is a gap before costs, so on its own it says nothing about what that trade pays.
Total potential is the one locked tile. It sums the profit on every trade listed, each after trading fees and the withdrawal fee, across many separate coins, most of which nobody would do at once. It is a measure of how busy the board is, not a payout, and its (i) says so. If some of those rows have a withdrawal fee we could not confirm, the (i) counts them too, because nothing was deducted for it.
Search, Sort and Filters: what each one does
The search box matches a token symbol or an exchange name and is open to everyone: type MEXC to see only routes touching MEXC, or a ticker to check a coin you follow. One quirk on a free account: locked PRO rows carry no coin name in your browser, so a ticker search can never match them, while an exchange search still does, because the route on a locked row is real. If a search comes back empty while PRO rows are live, the board tells you so rather than implying the market is quiet.
Sort re-ranks the board by Spread, Profit, Liquidity or Latest. Every account opens on Spread, high to low; the other three are PRO. Profit is the money view at the size the books can take, Liquidity finds rows that can take real capital, Latest surfaces what was just verified.
Filters is also PRO: a minimum spread, a minimum liquidity floor in dollars, and a toggle chip for every exchange and network in the feed, applied live as prices refresh. The biggest time-saver is switching off every exchange where you do not hold a funded account; worked setups are in using filters to find the right opportunities. On a free account both controls show a padlock and a short explanation instead.
How to read a single row
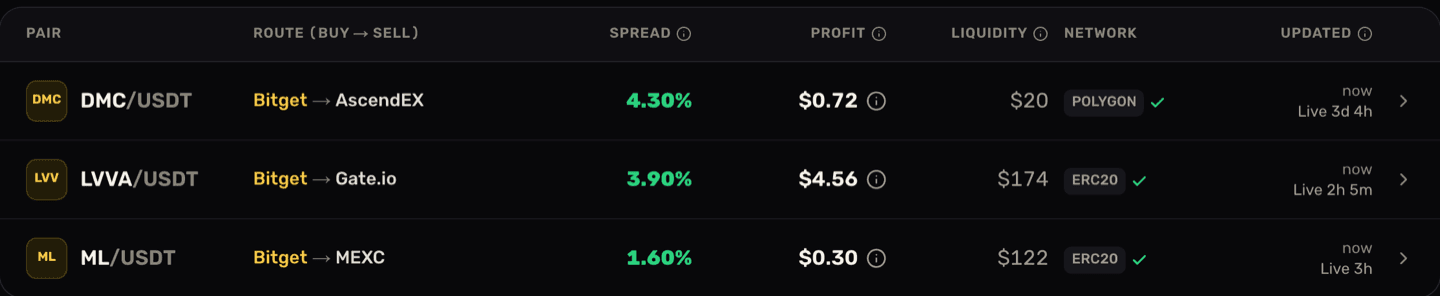
Pair
The token and its quote currency, for example LVVA/USDT, with the coin's logo alongside. The quote is almost always USDT, so everything is priced in dollars.
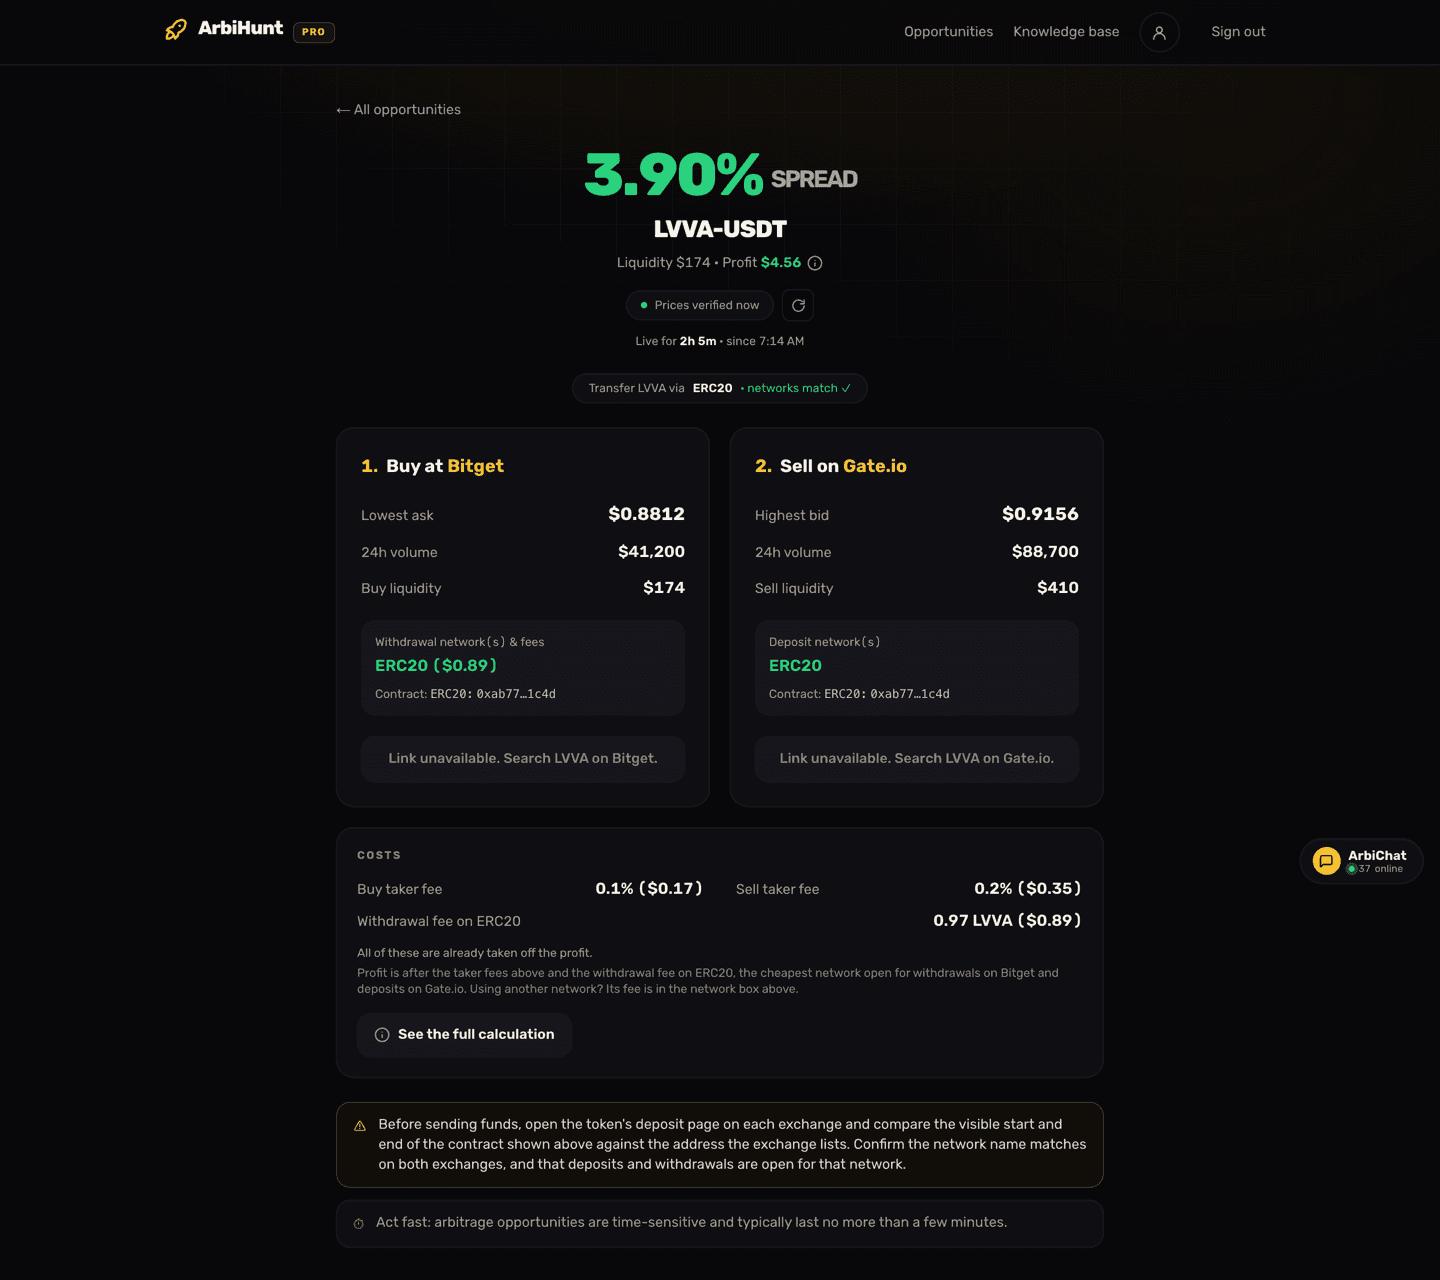
What good looks like: a coin you can verify. The ticker alone proves nothing, because two exchanges can list entirely different tokens under the same symbol. The opportunity detail screen shows the contract address on each leg (a PRO field) so you can confirm it is the same asset.
Route (buy → sell)
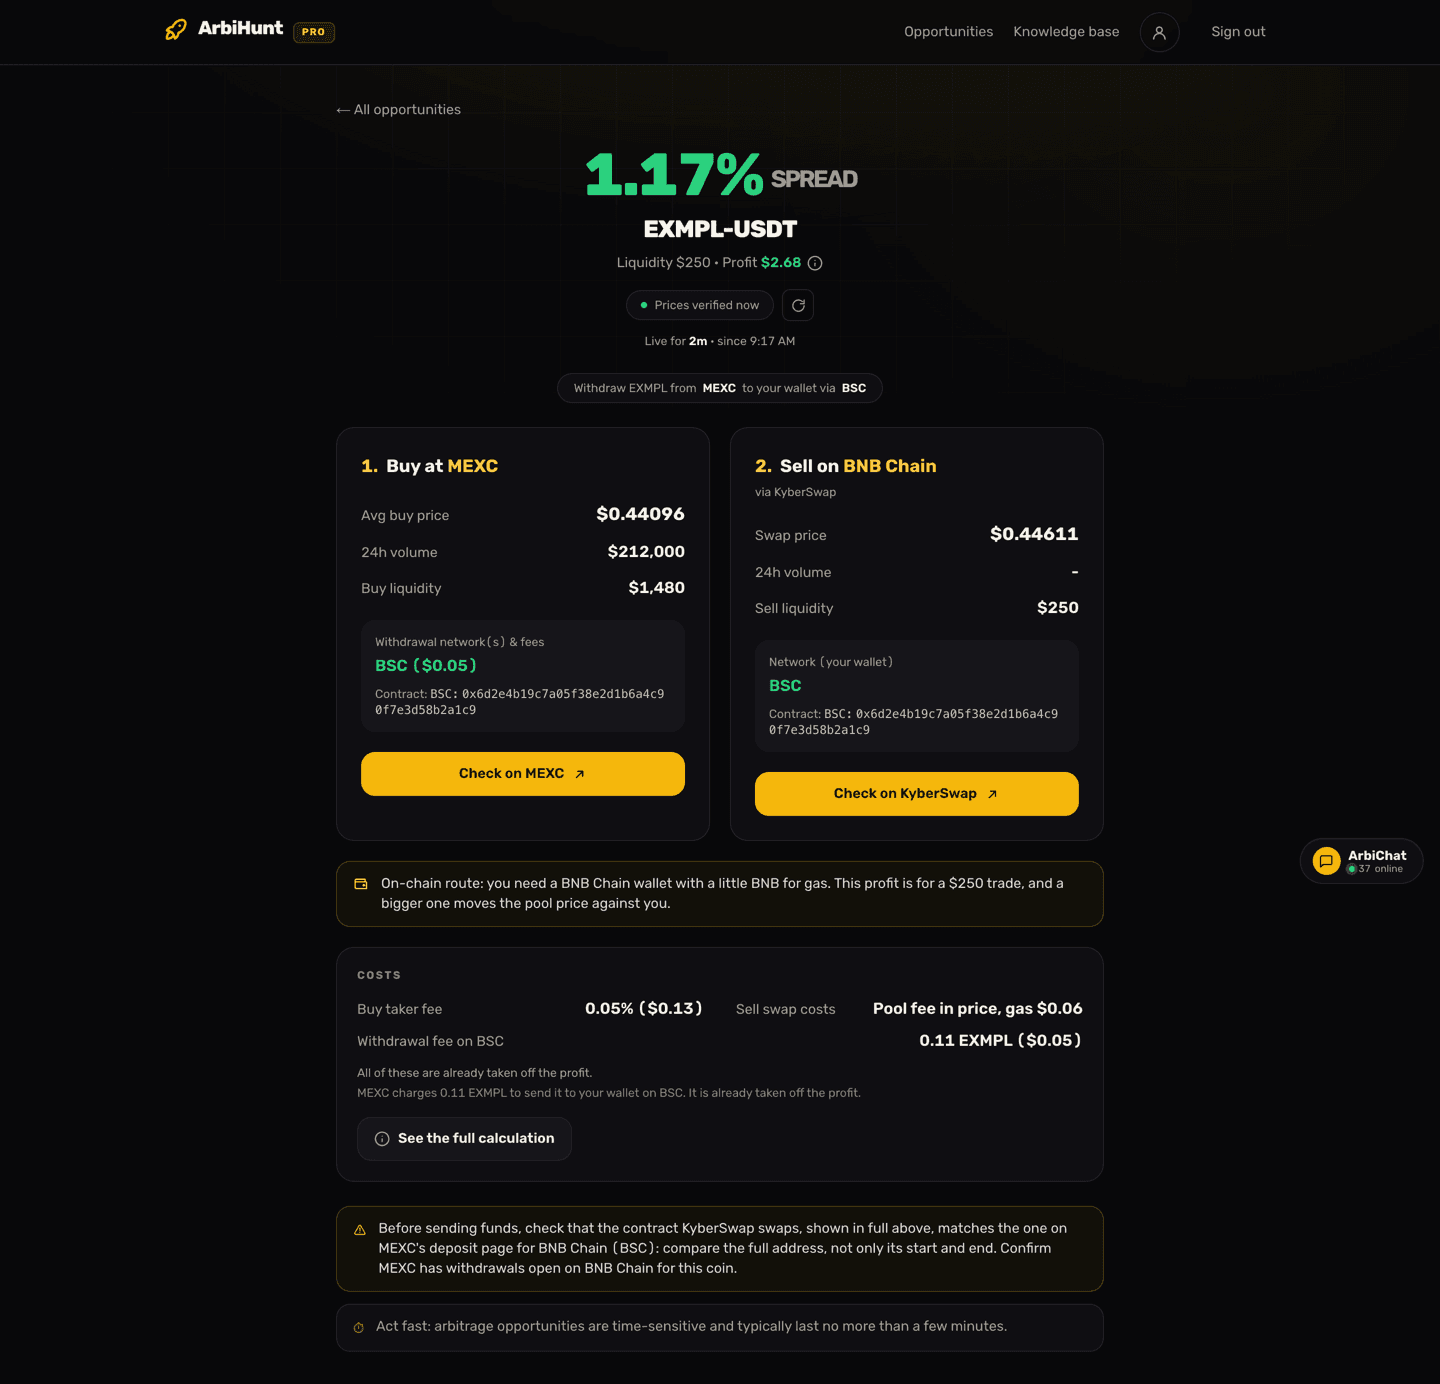
Two venue names. The gold one on the left is where you buy, the one on the right is where you sell. Bitget → Gate.io means buy on Bitget, withdraw the coin, deposit it on Gate.io, sell it there. A DEX badge marks an on-chain route, where one side is a swap on a blockchain such as BNB Chain rather than an exchange.
What good looks like: two venues where you already hold funded, verified accounts. A big spread on an exchange you have no account with is worth nothing today: KYC and funding take longer than the gap lives. ArbiHunt also pauses a venue deliberately at times, for example after members report withdrawal problems, and a paused exchange drops out of the feed until it returns.
Spread and Profit
The Spread is the raw gap between the two prices, before any cost. It is worked out from executable prices, the lowest ask on the buy venue against the highest bid on the sell venue, read from the live order books rather than a mid-price ticker. It is the headline, not the take-home: every cost below comes out of it. It is also the PRO rule, a spread of 2% or more.
The Profit is what the trade leaves you in dollars, and the number that decides whether a row is worth your afternoon. It is measured at the size the books can take, not at a size you choose: ArbiHunt walks both order books to the depth actually sitting on them, so each marginal fill pays its real price, then takes off the taker fee on both legs and the exchange withdrawal fee on the cheapest network open on both sides. Trades that would lose money after that fee are not listed at all.
The full cost stack between the two numbers is in spread vs. net profit.
The withdrawal fee is already in the profit
The Profit is after the two taker fees, on-book liquidity and the exchange withdrawal fee on the cheapest network open for withdrawals on the buy side and deposits on the sell side; the Spread is before all of them. PRO members can tap the (i) beside any profit to see every step with the row's real numbers, ending with the return, the profit divided by the trade size. When an exchange gives no withdrawal fee we can confirm, nothing is deducted for it, the (i) turns into a gold alert glyph, and the calculation says so: check that fee yourself and take it off.
What good looks like: a dollar amount that justifies buying, withdrawing, waiting for confirmations and selling, at a size you can deploy. The profit is measured at the size the books could take, and the withdrawal fee is flat, so a much smaller trade keeps less than a proportional share. Scepticism at the top end too: a screaming spread is a prompt to investigate, not to celebrate, since it usually means a nearly empty order book, a suspended wallet on one side, or two different tokens sharing a ticker. On a free account the Profit cell is locked on every exchange row; on-chain (DEX) rows show it to everyone for now.
Liquidity
How much money the order books can absorb near those executable prices. The detail screen splits it per leg, and the smaller of the two is your real ceiling: the thinner side caps the whole trade. The profit is not measured at this number but at the row's trade size, how much the two books can match before the price gap, after trading fees, closes. That is often much smaller than the liquidity, so reading the liquidity as the size the profit describes overstates many rows; PRO members see the trade size in the (i).
What good looks like: your intended size sits comfortably inside the number, not at it. A $100 position fills near the quoted prices on a row showing $420 of depth; a $420 position walks the book and hands part of the gap back as slippage. Cap yourself at a fraction of the depth, a quarter being a conservative start, less on thin coins, and remember the withdrawal fee does not shrink with you.
Network
The blockchain network ArbiHunt expects you to move the coin over, shown as a chip. It is the network the profit was worked out on. When both venues support that chain, with withdrawals open on the buy side and deposits open on the sell side, a green tick appears beside it.
What good looks like: the tick is present and the chain is one you are comfortable sending on. Its withdrawal fee is already in the profit (cents on Tron or Polygon, dollars on Ethereum), but transfer speed still decides whether the gap exists when your coins land. Read choosing the right network before your first transfer.
No tick means stop and verify
A missing network match is a hard warning, not a nuisance: sending a coin over a chain the receiving exchange does not support can mean an unrecoverable loss. Compare the withdrawal networks on the buy leg against the deposit networks on the sell leg, and confirm the contract addresses match, before anything moves.
Updated
How long ago that row's numbers were last read from the exchanges' order books. Under ten minutes it counts in seconds, so a row genuinely reads "7s ago" and ticks upward while you look at it.
What good looks like: seconds. If the stamp is materially older, treat every other number in the row as a hypothesis to re-verify on the exchanges.
Each row also shows Live: how long the trade has been on the board, such as "Live 2h 5m", counting through gaps of up to ten minutes as prices flicker (a row that has only just appeared shows none yet). It is how long the gap has held so far, not how long it has left.
What a free account sees, and what is locked
Free and PRO run on exactly the same live feed across all 26 exchanges. The difference is a threshold at a 2% spread.
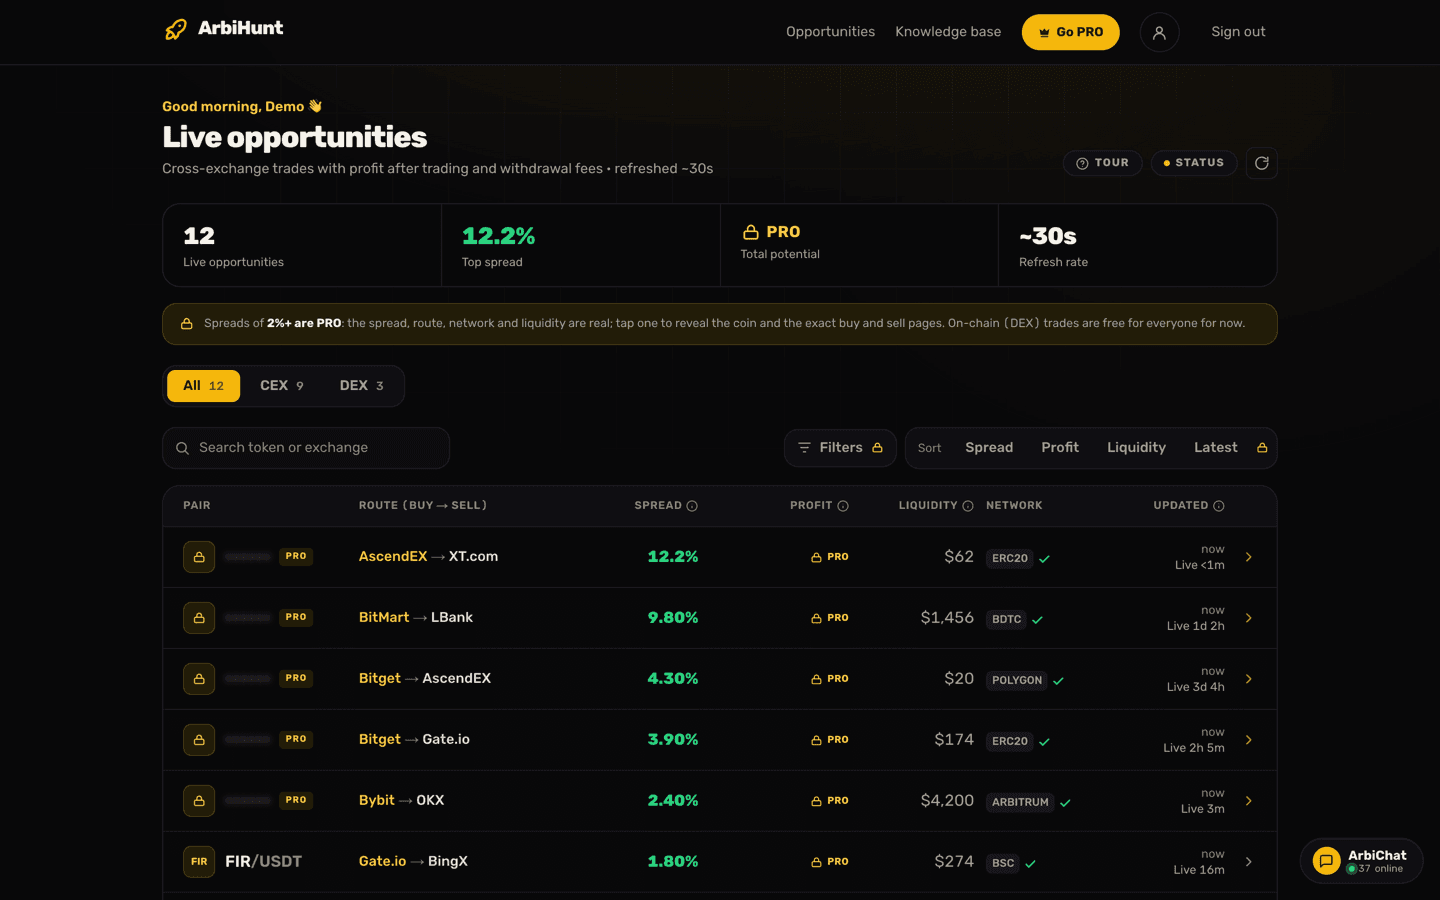
Below a 2% spread, an opportunity is essentially yours on the free plan: coin, route, spread, liquidity, network, freshness, the detail screen with both legs priced and the withdrawal fee in coins, and the "Check on exchange" link out to each venue. Three things stay behind the padlock on exchange rows: the profit in dollars, the step-by-step calculation behind it, and the contract address on each leg.
At a 2% spread and above, the row is PRO. It stays on the board in rank order, with its real spread, route, liquidity, network and timestamp; only the coin name is blurred behind a PRO badge. That masking happens on the server, so the token, the trade links and the contract addresses never reach your browser, and tapping the row opens an upgrade prompt.
The free tier is a genuine working tool for the everyday band under a 2% spread; the full comparison is in free vs PRO.
See the whole board
PRO reveals every trade with a spread of 2% or more, the profit in dollars on every row with its step-by-step calculation, plus filters and sorting across all 26 exchanges.
Why freshness decides whether any of this is real
Arbitrage gaps exist because venues briefly disagree on price, and other traders, bots included, are closing the same gaps you are reading. ArbiHunt's own guidance on the detail screen is blunt: opportunities typically last no more than a few minutes.
The clock that hurts most is the blockchain's, not the scanner's. Your buy fills in seconds, but the transfer between exchanges can take under a minute on a fast chain or half an hour on a congested one, so the gap can close before your deposit confirms. That is why experienced traders pre-fund both sides and skip the transfer where they can.
A row that has dropped off the live board still opens: the detail screen serves its last recorded values behind a banner giving their age, then stops after 24 hours. A trade that left the board because it no longer makes money after the withdrawal fee, or whose route has just changed, opens as no longer live instead.
The pre-trade checklist
Run this every time, in order, before funds move:
- Open the detail screen and read both legs. The field-by-field guide explains each one.
- Confirm it is the same token. Compare the contract address on both exchanges; same ticker does not mean same asset.
- Confirm transfers are open: withdrawals enabled on the buy side, deposits enabled on the sell side.
- Check the withdrawal network. The profit already has that network's fee taken off; if you will send on a different one, swap in its fee. If the fee reads "not deducted", look it up and take it off yourself.
- Size inside the liquidity, using the thinner leg as your ceiling.
- Recompute at your size if it is smaller than the trade size the row was measured at: the withdrawal fee stays the same, so your profit shrinks faster than your size. If it does not beat doing nothing, do nothing.
- Re-check both order books in the final seconds before you place the buy. The board is a fresh snapshot, not a guarantee.
If any step fails, skip the row: the feed refreshes all day and another will appear. When everything checks out, the full flow is in how to execute an arbitrage trade.
Nothing here is financial advice. Arbitrage carries real risk, prices can move in seconds, and an opportunity on the board may not be executable by the time you reach it. Trade small until the checklist is a habit.
See it live
ArbiHunt scans 26 exchanges in real time and ranks every spread by true net profit, after fees, withdrawals and live liquidity.