The spread is the gap between the price you can buy a coin at on one exchange and the price you can sell it at on another. Net profit is what is left after every cost. They are different numbers, they can point in opposite directions, and mistaking the first for the second is the most expensive habit in cross-exchange arbitrage.
Below: the five costs that separate them, one formula, and two trades worked in dollars, including a healthy-looking 5% spread that finishes underwater.
What a spread is, and what it quietly leaves out
If a coin's lowest ask is $1.0000 on Exchange A and its highest bid is $1.0250 on Exchange B, the gross spread is 2.50%. That is a real, executable gap between two order books at one instant, and it is the entire extent of what it tells you.
It says nothing about what the two exchanges charge to fill your orders, what the blockchain charges to move the coin, how deep those prices go, or whether the gap survives the transfer. Each of those is a subtraction.
The five costs between the quote and your balance
1. The taker fee on the buy
Arbitrage legs get filled as taker orders, hitting resting liquidity, because a maker order that sits unfilled while the gap closes is worse than a fee. Around 0.1% is the common default, but the real figure varies by exchange and volume tier: see Trading fees: maker vs taker.
On a $3,000 buy leg, 0.1% is $3.00.
2. The taker fee on the sell
You pay it again on the way out, and counting it once is the classic beginner error. The two rates are set independently, per exchange and per volume tier, so read both off the Costs card rather than assuming they match.
Two legs at 0.1% each means roughly 0.2% of your position is gone before the coin has moved anywhere.
3. The flat withdrawal fee
Moving the coin to the sell exchange costs a withdrawal fee set by the exchange for that network. The word that matters is flat: it does not scale with your trade, so it is trivial on size and brutal on small tickets.
A $9 ERC-20 withdrawal is 2.25% of a $400 trade and 0.09% of a $10,000 trade: same fee, two completely different trades. It also varies enormously by network for the identical coin, which makes the network a profit decision, not a technical detail. Both points are unpacked in Withdrawal fees explained.
4. Slippage against real depth
A quoted price is only good for the quantity resting at that price. Fill more and you walk into worse levels, and your average fill drifts away from the headline. That drift is slippage, and on the thin, low-cap markets where the biggest spreads appear it is usually the largest cost of the five.
Say you need to sell 9,755 coins and the bid book looks like this:
| Level | Price | Coins |
|---|---|---|
| 1 | $0.0420 | 2,860 |
| 2 | $0.0412 | 3,000 |
| 3 | $0.0400 | 5,000 |
Your fill averages $0.04096, not $0.0420. Against the headline that is 2.5% of the sell leg, gone, on a trade whose whole thesis was a 5% gap.
5. The time the transfer takes
The fifth cost has no fee attached and can still be the biggest. Between your buy and your sell the coin has to leave one exchange, confirm on-chain and credit at the other, and the spread is not obliged to wait: ArbiHunt's opportunity pages say outright that opportunities are time-sensitive and typically last no more than a few minutes. Confirmation counts and queues differ wildly by chain and by venue: see how long deposits and withdrawals take.
Worse outcomes are available too, such as withdrawals paused on the buy side, no shared network between the two venues, or the same ticker being a different contract on each, and they are catalogued in the risks of crypto arbitrage.
Your breakeven spread, in one line of arithmetic
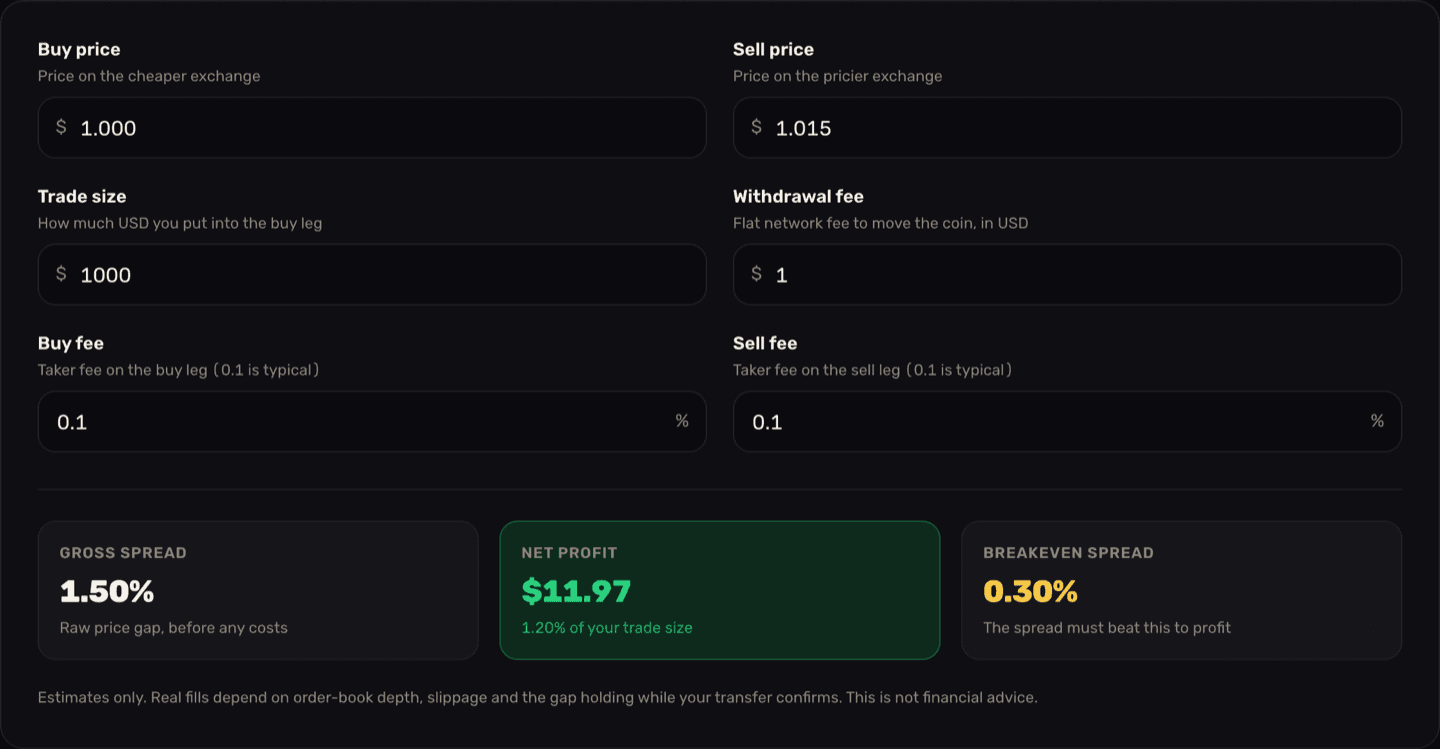
Before you evaluate any opportunity, know the spread you need just to get your money back at your usual size. That is your breakeven spread, and it is the formula the free ArbiHunt calculator runs:
breakeven % = ( (1 + withdrawal fee / trade size)
                / ((1 - buy fee) * (1 - sell fee))
                - 1 ) * 100
A close-enough version you can do without a calculator:
breakeven % ≈ buy fee % + sell fee % + (withdrawal fee / trade size * 100)
Two readings of the same fee stack:
| Trade size | Fees | Withdrawal | Breakeven spread |
|---|---|---|---|
| $400 | 0.2% + 0.2% | $9 | 2.66% |
| $3,000 | 0.1% + 0.1% | $0.20 | 0.21% |
The $400 trader needs a spread more than twelve times wider than the $3,000 trader to break even on the same coin. Nothing about the market changed between those rows, only the size and the network.
Compute yours once, then reuse it
Run it with the size you actually deploy, the fees on the two exchanges you use and the withdrawal fee on the network you transfer over. Any spread that does not clear it with room to spare for slippage is not an opportunity, however good the percentage looks.
Worked example 1: a 2.5% spread that keeps $62.67
Buy at $1.0000, sell at $1.0250, deploy $3,000. Taker fees 0.1% on both legs. Withdrawal fee 0.2 coins, about $0.20. Breakeven from the table above: 0.21%.
The naive math: 3,000 coins times the $0.025 gap = $75.00.
What actually happens:
- Buy. $3,000 buys 3,000 coins; the 0.1% taker fee takes 3 of them. You hold 2,997 coins.
- Transfer. The flat withdrawal fee is 0.2 coins. 2,996.8 coins land on the sell exchange.
- Sell. The bid book holds 1,200 coins at $1.0250, then 1,000 at $1.0230, then the rest at $1.0200. Gross proceeds $3,065.74, an average fill of $1.0230.
- Sell fee. 0.1% of that is $3.07. Net proceeds $3,062.67.
Net profit: $3,062.67 − $3,000.00 = $62.67, or 2.09% on the capital deployed. In the table below, the two coin-denominated costs are valued at what those coins would have sold for.
| Item | Amount |
|---|---|
| Gross gap on paper (3,000 × $0.025) | +$75.00 |
| Buy taker fee, 0.1% | −$3.07 |
| Withdrawal fee, 0.2 coins | −$0.21 |
| Slippage on the sell fills | −$5.98 |
| Sell taker fee, 0.1% | −$3.07 |
| Net profit | +$62.67 |
Costs took $12.33 of the $75 headline, about one dollar in six, on a trade that was never in danger: a 2.50% spread against a 0.21% breakeven left room to absorb the slippage and still pay.
Worked example 2: a 5% spread that loses $1.28
Now the trade that looks better and pays worse. The coin shows $0.0400 on the buy side and $0.0420 on the sell side, a 5.00% gross spread, and you deploy $400. Both venues charge 0.2% taker, and the only network they share is ERC-20, at a $9 withdrawal fee.
- Buy. $400 buys 10,000 coins; the 0.2% fee takes 20. You hold 9,980 coins.
- Transfer. The $9 ERC-20 fee is about 225 coins at the buy price. 9,755 coins arrive.
- Sell. That is the thin book from the slippage section above. Gross proceeds $399.52, an average fill of $0.04096 instead of $0.0420.
- Sell fee. 0.2% is $0.80. Net proceeds $398.72.
Net profit: $398.72 − $400.00 = −$1.28. A 5% spread, executed exactly as advertised, that hands back less than you started with.
| Item | Amount |
|---|---|
| Gross gap on paper (10,000 × $0.0020) | +$20.00 |
| Buy taker fee, 0.2% | −$0.84 |
| Withdrawal fee, $9 on ERC-20 | −$9.45 |
| Slippage on the sell fills | −$10.19 |
| Sell taker fee, 0.2% | −$0.80 |
| Net result | −$1.28 |
Put the two tables side by side and the lesson stops being about percentages. Example 1 had the smaller spread and made money, because $3,000 of size crushed the flat fee and the book was deep enough to fill into. Example 2 lost because $9 of its $20 went to Ethereum and another $10 to a book that could not absorb the position.
Note what the breakeven check alone would have said: 2.66% needed, 5.00% available, go. Breakeven prices the fixed costs and assumes you fill at the quoted price. Slippage is what it cannot see, and on a thin book it outweighs everything else combined. A rule of thumb:
net % ≈ gross spread % − breakeven % − slippage %
It runs slightly optimistic, so treat a marginal pass as a fail.
What ArbiHunt's profit covers
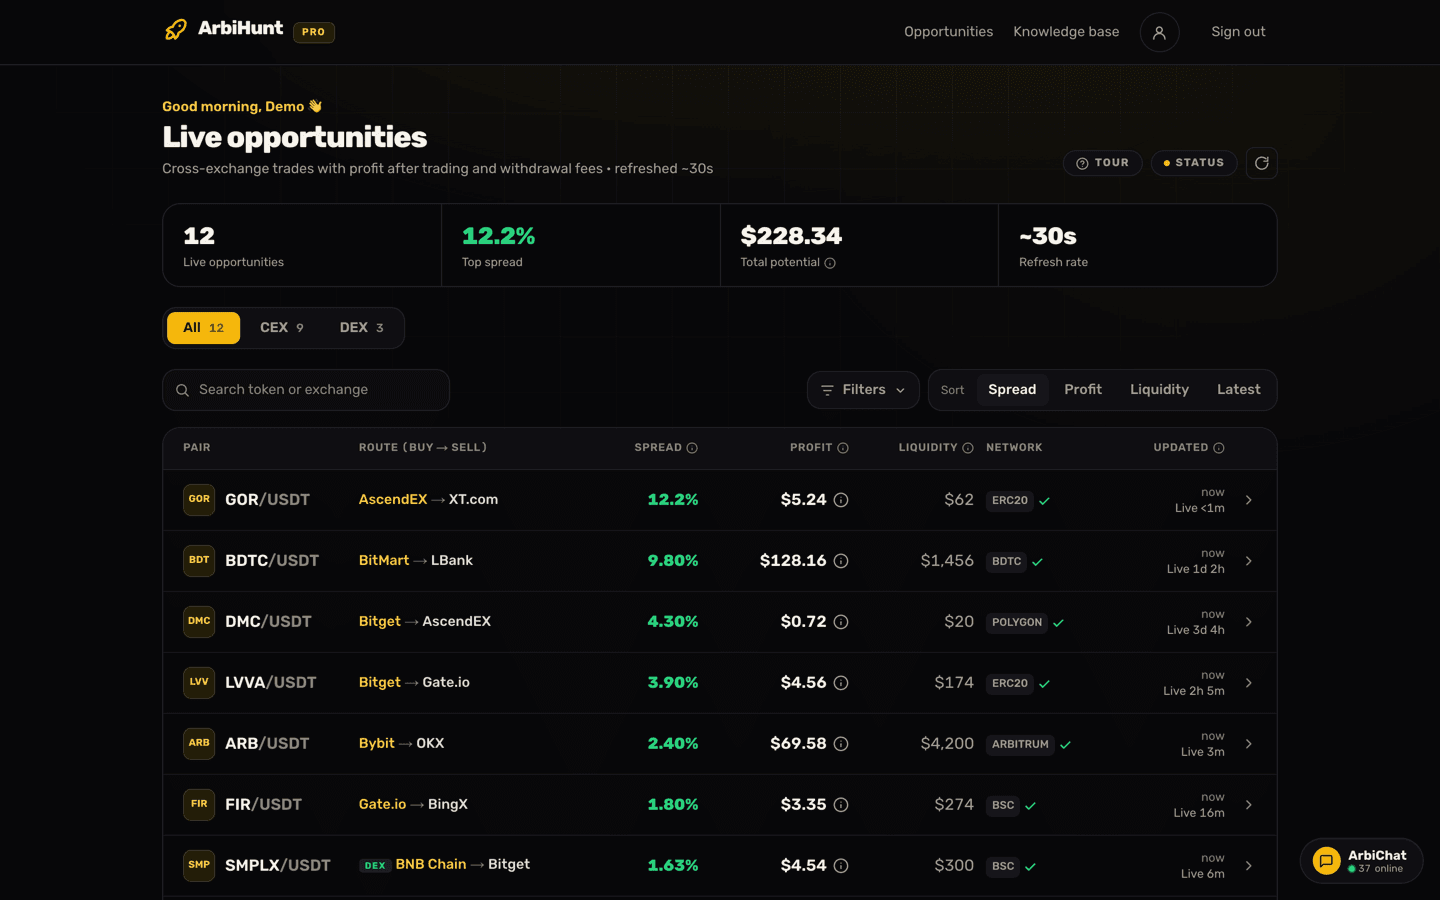
ArbiHunt starts from executable prices instead of a mid-price ticker: the lowest ask on the buy venue against the highest bid on the sell venue. From there, it walks both order books level by level at a size the books can take, so slippage is in the average prices, and then takes off the taker fee on both legs and the exchange withdrawal fee on the cheapest network open for withdrawals on the buy exchange and deposits on the sell exchange. What is left is the Profit on the row.
The percentage on the board is the spread: the raw gap between the two prices, before any of those costs. The Profit beside it is what the costs leave, so the two answer different questions and you need both. PRO members see them joined up in the calculation below, whose last line, the return, is the profit divided by the trade size, and always smaller than the spread. A trade that would lose money after the withdrawal fee is not listed at all.
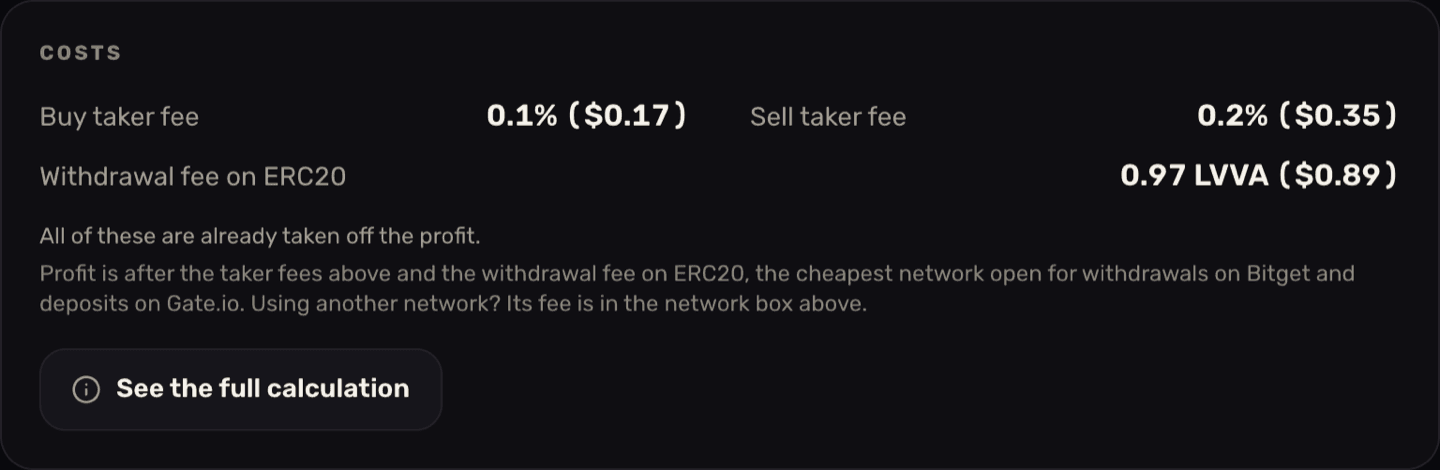
Every cost on that card is already inside the profit. PRO members can tap the (i) beside any profit, or See the full calculation on this card, to see every step with the row's real numbers:
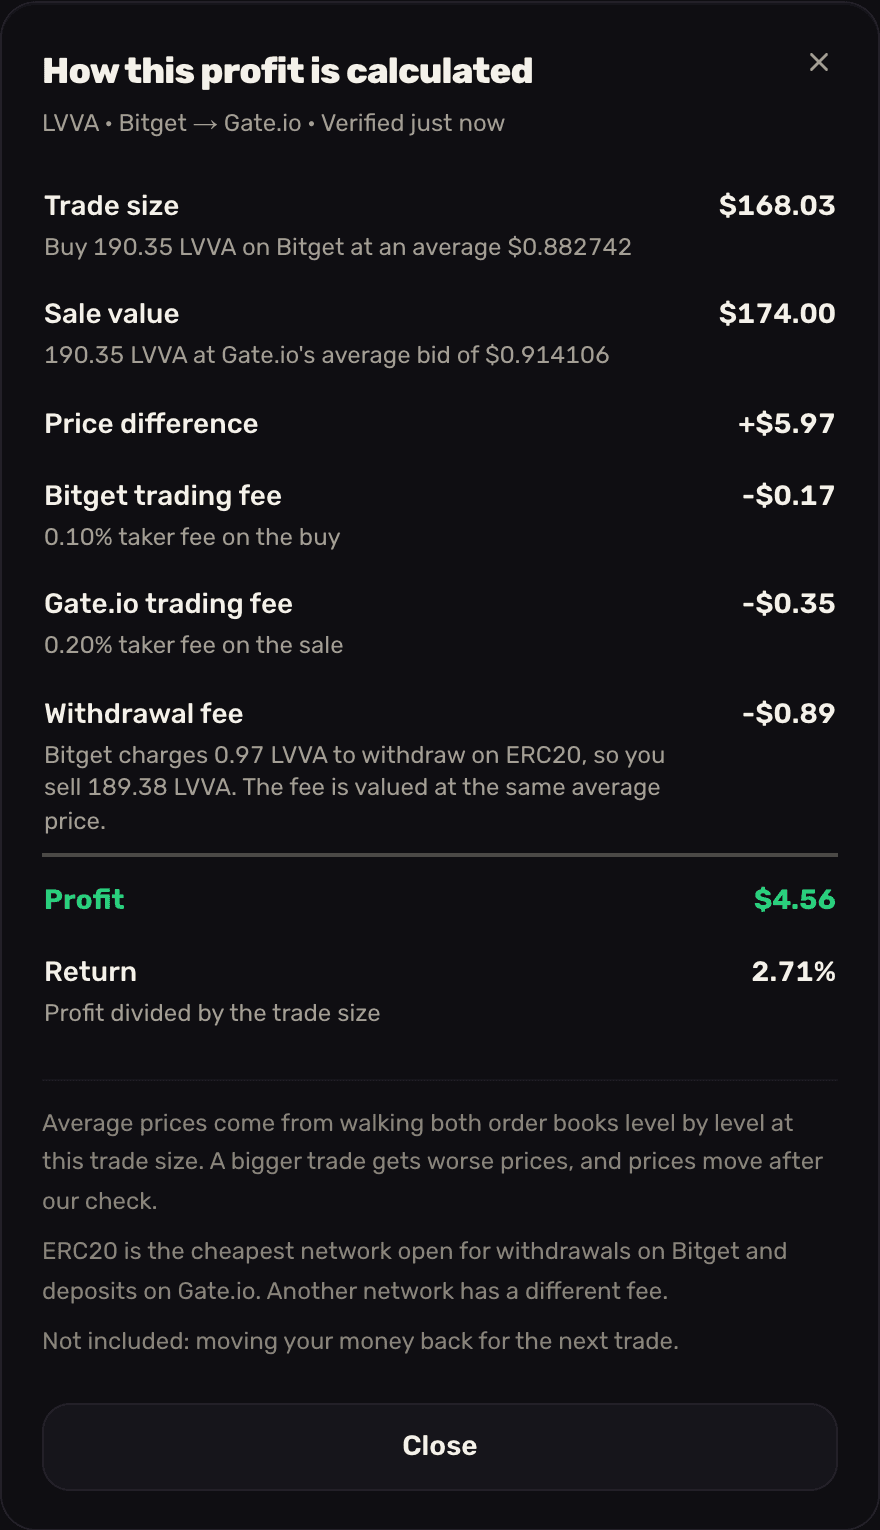
Two things stay outside the number, and the calculation says so. When an exchange gives no withdrawal fee we can confirm, nothing is deducted for it: the row shows a gold alert glyph on its (i) for PRO members, the calculation reads "not deducted", and the Costs card reads "Not published, not deducted" for everyone. Check that fee on the exchange and take it off yourself. And moving your money back for the next trade is never included. Everything else on that screen is walked through in understanding the opportunity details.
The profit is measured at one trade size, the one the books could take. If you trade less, the withdrawal fee does not shrink with you, so your profit falls faster than your size. Drop the two prices, your size, the two taker fees and the withdrawal fee into the arbitrage calculator and it reworks the trade at your size in about ten seconds, with your breakeven spread printed beside the result. It does the fixed costs exactly; slippage at your size is still on you.
Every figure is a snapshot
The board refreshes about every 30 seconds, and an order book can move faster than that. A gap that nets $60 when you read it can be gone before you finish the buy leg. Treat every number, ArbiHunt's included, as something to re-verify on the exchange at execution time.
Why the biggest percentage is rarely the biggest payday
The dashboard puts the spread and the dollars in adjacent columns on purpose. They disagree constantly.
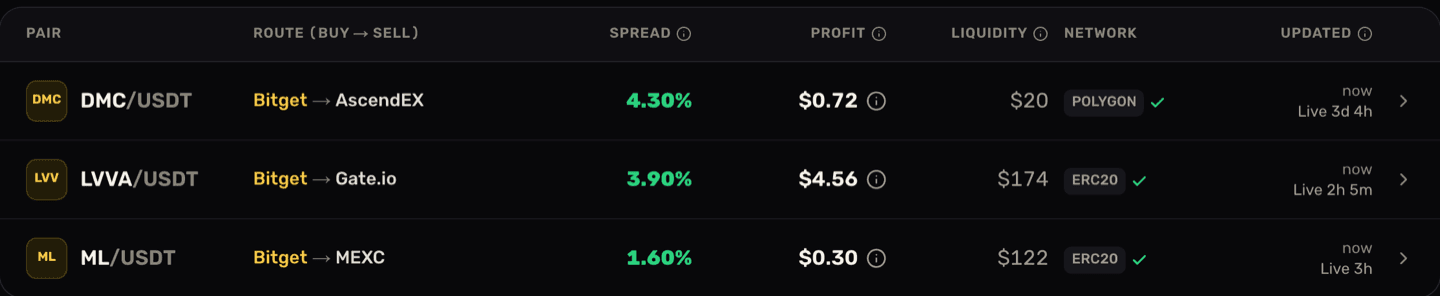
The top row is a 4.30% spread paying $0.72. The row beneath it is a smaller 3.90% spread paying $4.56. The difference is mostly in the Liquidity column: $20 of depth against $174. A percentage describes a price gap; the profit describes that gap, less its costs, multiplied by how much of it the market will actually let you have.
The third row shows the withdrawal fee at work. ML spreads 1.60% on $122 of depth, but its calculation shows $1.36 of profit before a $1.06 ERC20 withdrawal fee, which leaves $0.30, a 0.25% return. Had both exchanges shared a cheaper network, the same trade would have paid several times more, which is why the network is a profit decision and not a technical detail. And a row that cannot pay its withdrawal fee at all never reaches the board.
See the dollars, not just the gap
ArbiHunt prices every opportunity across 26 exchanges against real order-book depth, each venue's actual taker fees and the exchange withdrawal fee, so you are comparing what each trade leaves you instead of headline percentages.
The habit that replaces guessing
Before any trade, four questions, in this order:
- What is my breakeven spread at this size, on this network, with these two exchanges?
- Does the trade still pay at my size, not just at the size the board measured?
- How much depth is behind it, and is that at least as large as the position I want?
- Is the withdrawal network ArbiHunt used the one I will use? If not, swap in that network's fee.
If you cannot answer all four in dollars, you do not have an edge yet: you have a headline. For what these trades actually return once the arithmetic is done properly, read is crypto arbitrage profitable?
ArbiHunt never connects to your exchange accounts, never asks for API keys, never holds funds and never places an order. It is an information tool; you make every trade yourself. Nothing here is financial advice, and crypto trading carries real risk of loss.
See it live
ArbiHunt scans 26 exchanges in real time and ranks every spread by true net profit, after fees, withdrawals and live liquidity.